Gabriella OnessimoFollowing Up on Food Borne IllnessFor my midterm this semester, I looked at data from the National Outbreak Reporting System from the Center for Disease Control (CDC) as…4 min read·Dec 6, 2021----
Gabriella Onessimorough draft of chartsI created my potential charts on Flourish, which I am now kind of regretting because it was working against me and not with me. For my…1 min read·Nov 18, 2021----
Gabriella Onessimodata takeawaysFor my final, I would like to focus on diversity in the fashion industry from a workforce perspective.1 min read·Nov 9, 2021----
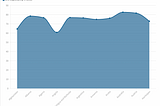
Gabriella Onessimoworld life expectancy charts + finalThe metric I focused on from the Life Expectancy data is 2018 life expectancy ages in all of the “A” countries. I looked at all of these…3 min read·Nov 2, 2021----
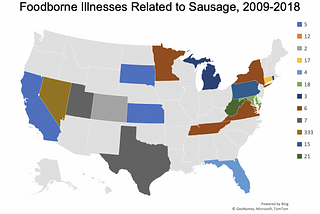
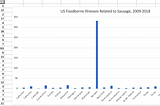
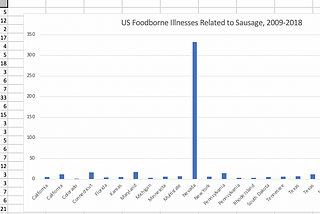
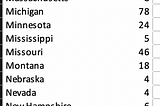
Gabriella Onessimosausage charts + CDC dataFor the midterm, my food data is centered around sausage. Because sausage is yummy and a little problematic.2 min read·Oct 18, 2021----
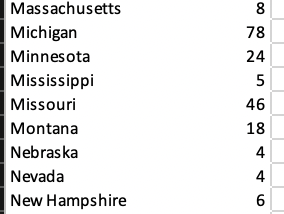
Gabriella Onessimopivot tables on bigfootPersonally, I don’t know if I necessarily believe in Bigfoot. In the Bigfoot sightings data across the United States, over 4000 people do…2 min read·Oct 6, 2021----
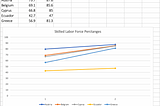
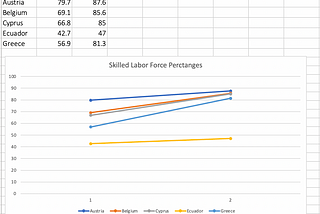
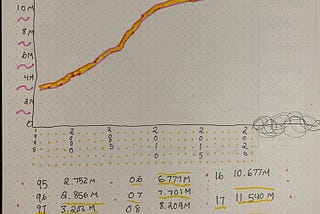
Gabriella Onessimoslope chartsFor this assignment’s data metric, I chose to look at the rise of the skilled labor force (meaning college graduates/skilled individuals…1 min read·Sep 22, 2021----
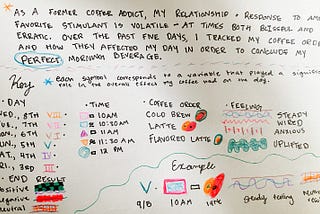
Gabriella Onessimodear data: a week’s observations on coffeeIn the above data set, I created a visual representation of my coffee orders and their effects on my mind, body and day. For me, drinking…1 min read·Sep 8, 2021----
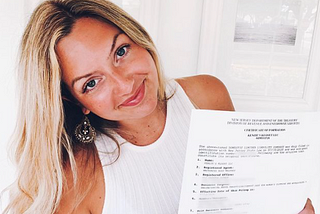
Gabriella OnessimoHow One Small Business is Thriving in the Age of COVIDOne of New Jersey’s youngest CEOs explains her plights as a result of the pandemic and how she overcomes them.6 min read·Dec 16, 2020----